KPI dashboards
Organise key performance indicators into a clear view for leaders and business owners.
We organise KPIs and executive reporting into a clear visual view for leaders and business owners. We start with the decision and available data, then define a suitable deliverable.
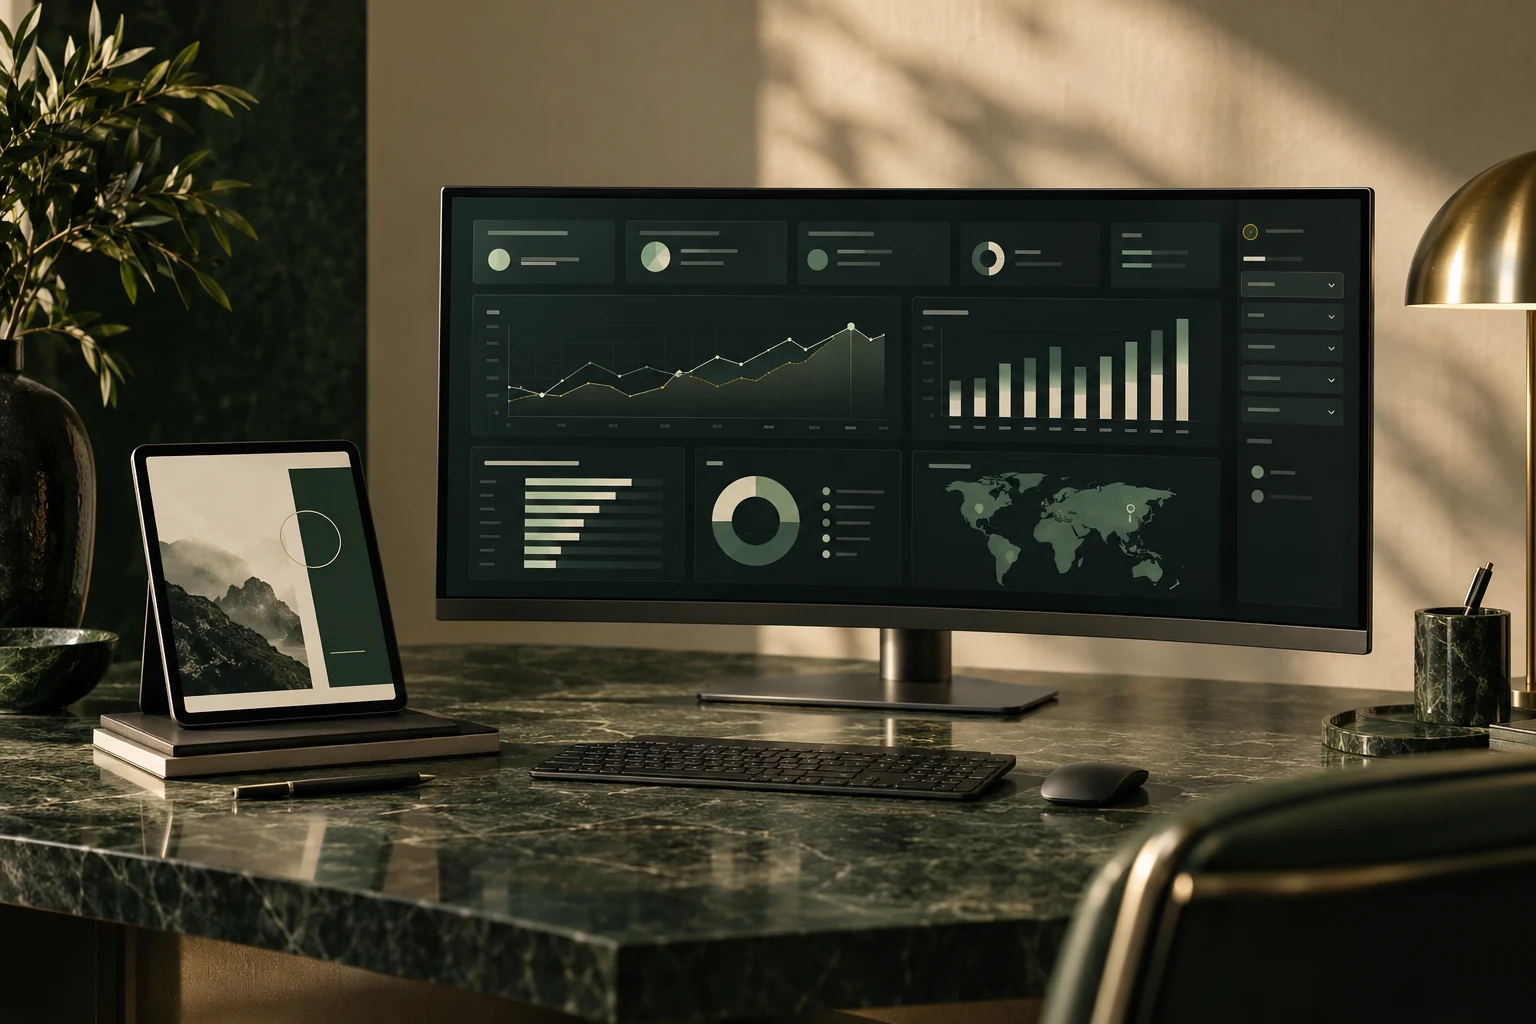
Start with the decision and available data; then choose the right dashboard or report.
Organise key performance indicators into a clear view for leaders and business owners.
A visual summary of business measures and trends to make the picture easier to read.
Descriptive analysis and visual summaries from structured files within an agreed scope.
Switch the view to see the indicators change. These sample values are illustrative; an actual dashboard uses a structured source file within an agreed scope.
Indicators and charts are illustrative interaction samples, not company or client results.
We review the goal and inputs before agreeing the tool and deliverables.
The decision, audience and available materials.
Agree the deliverables and suitable tools before production.
Deliver a clear concept and refine it within the agreed scope.
We first review data sources, licensing and refresh needs, then confirm feasibility and scope in a separate proposal. The local dashboard shown here does not include Power BI, system integrations or live refresh.
A local interactive dashboard from one structured Excel or CSV file, with an agreed set of indicators and charts. The current scope excludes cloud hosting, APIs and automatic refresh.
No. Values and charts in the demo are illustrative, to show presentation and interaction. They are not client data or business results.
Visuals on this page are AI-generated illustrative design concepts, not client projects or actual results.